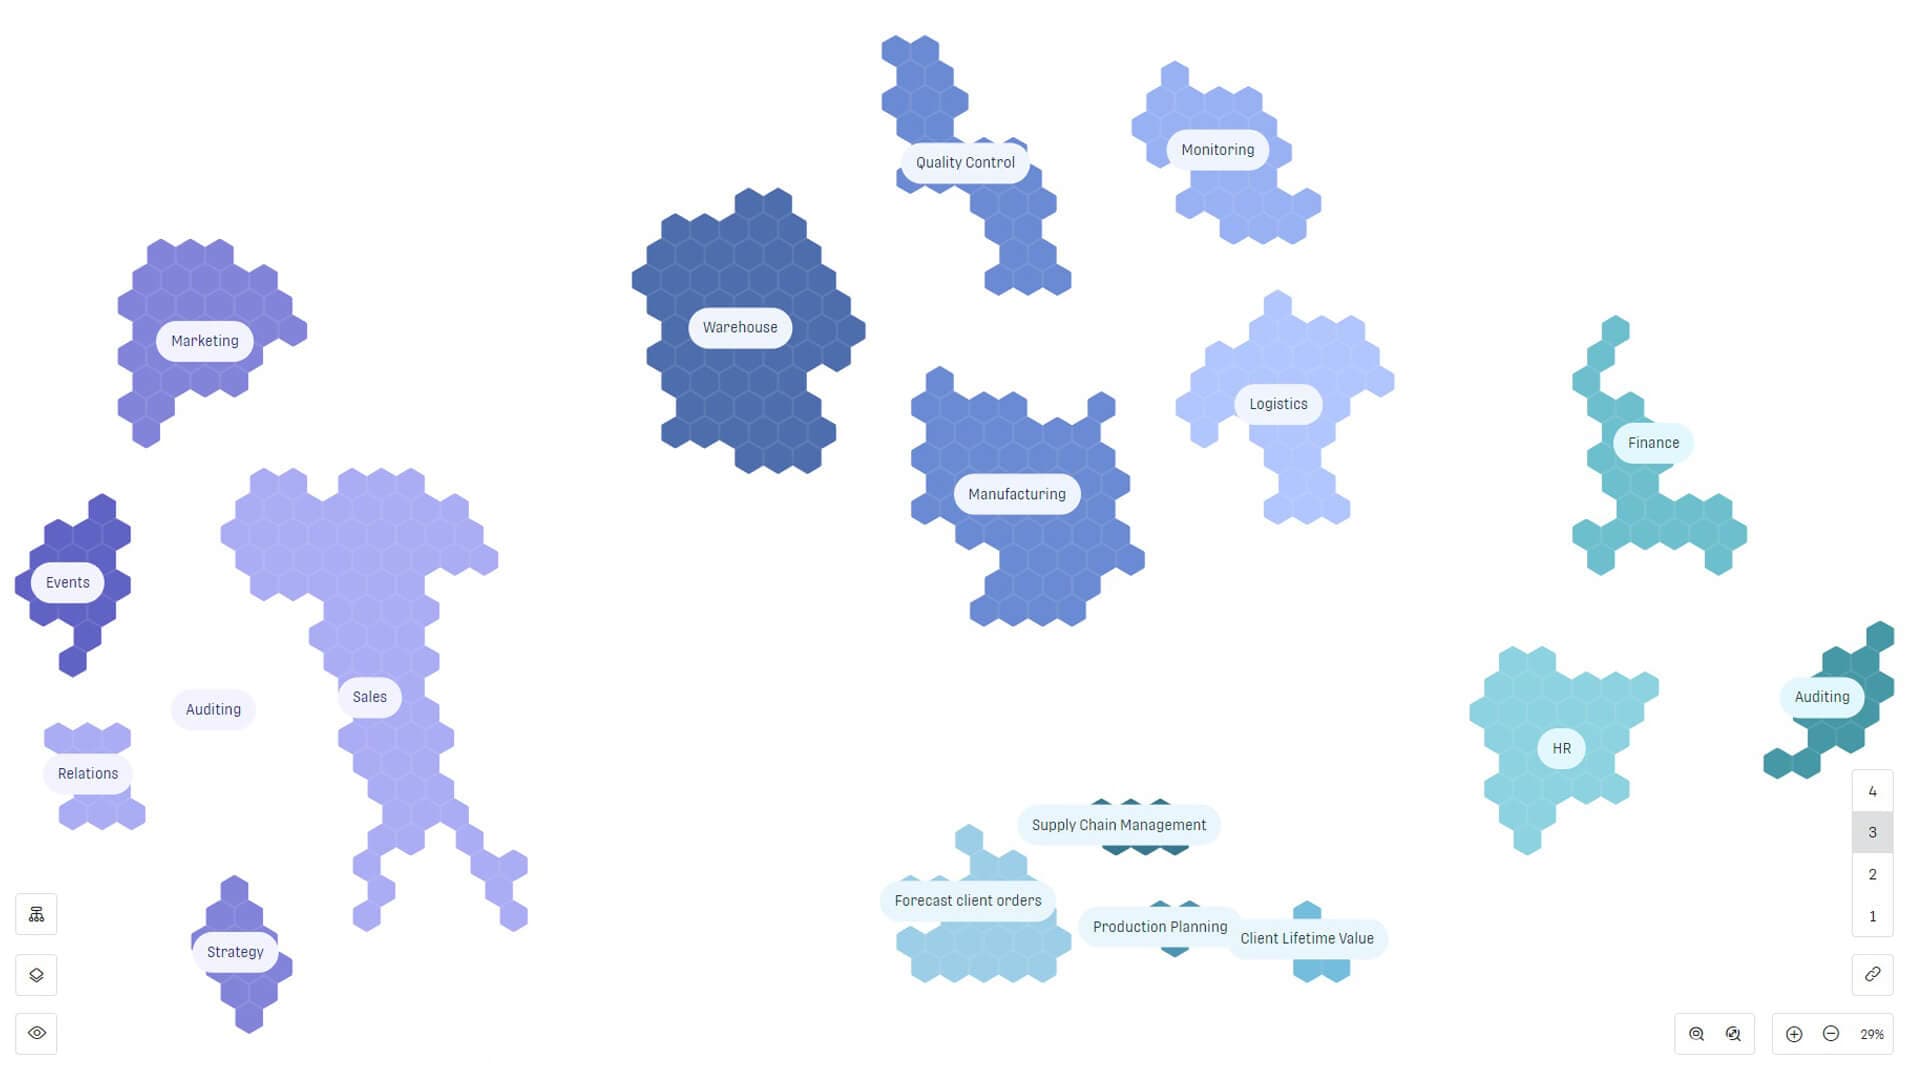
Data Cartography Map
 TypeScript
 Vue
VueSVG
Vite
Pannable & zoomable, interactive SVG map rendering data nodes as hexagons
Timeline
Aug 2021 - February 2023
Company
One Data
Team
Cross functional team of 8
Client & Project Details
One Data, a leading software company based in Germany, is revolutionizing data management with their flagship product, One Data—an AI-powered Data Product Builder. One of the main components of their product is the data cartography map.
The data cartography map is an interactive data map that allows powerful visibility to quickly discover and access available data assets & the relations between them.
At it's core, it's a large SVG component rendering each data asset as a hexagon, automatically clustering them together based on relevant attributes. The map can be zoomed & panned, viewed in different levels of detail and quality layers can be enabled to examine data assets with issues. Each data asset can be individually interacted with and multiple assets can be connected together with a "connection".
My Role
As an early team member on this project, I helped shape the base framework this component. During my tenure in this team, the team grew from 4 to 6 developers including 2 juniors, me as a senior & 3 principals / staff.
- Took key responsibilities in developing the first version of the component while navigating changing requirements.
- Collaborated regularly with data scientists on the team to understand the use cases.
- Helped release the MVP of the component within 6 months of quick iterations.
- Worked on many new features upgrading the functionality of the component in major ways.
- Onboarded 3 new principal developers onto the project enabling them to kick-off development quickly.
- Mentored & paired with junior developers in the team, helping them understand complicated concepts.
Implementation Details
An unorthodox setup
One Data's core software i.e. the Data Product Builder consists of many components such as App Builder, Data Source Manager, Workflow Builder, etc. allowing a data scientist to rapidly prototype & build custom data products as per their requirements. Initially, Data Cartography Map was built to be one of the custom components that could be configured in the App Builder. The source code for each custom component was packaged separately and versioned & released regularly. This unorthodox setup introduced many challenges not only in developing the component but also in it's usage. Some examples are:
- It was hard to develop & test the component individually since the whole One Data stack was needed with realistic data. We transitioned to using Storybook to allow easier development & quick automated testing.
- The App Builder's API didn't allow for seamless data fetching & updation, or even using Vue's reactivity system properly. Later on, it was decided to publish Data Cartography Map as a standalone application, which was kicked off after me.
- For basic UI components, we were dependent on the UI library used by App Builder & getting new components in there was a long process that required co-ordination between several teams.
All's Well That Ends Well
Although it was initially quite difficult to navigate all those challenges and iterate quickly, the initial prototype's success allowed more time to be spent in refactoring & improving the stack.
Product Demo
Searching the map
Toggling connections & Layers